


Redfin>New Listings Down 3% from 2019; Prices Soar 24% to $359,000 from '2015128
Pages:
1
 WGAN Forum WGAN ForumFounder & WGAN-TV Podcast Host Atlanta, Georgia |
DanSmigrod private msg quote post Address this user | |
| Media Release --- 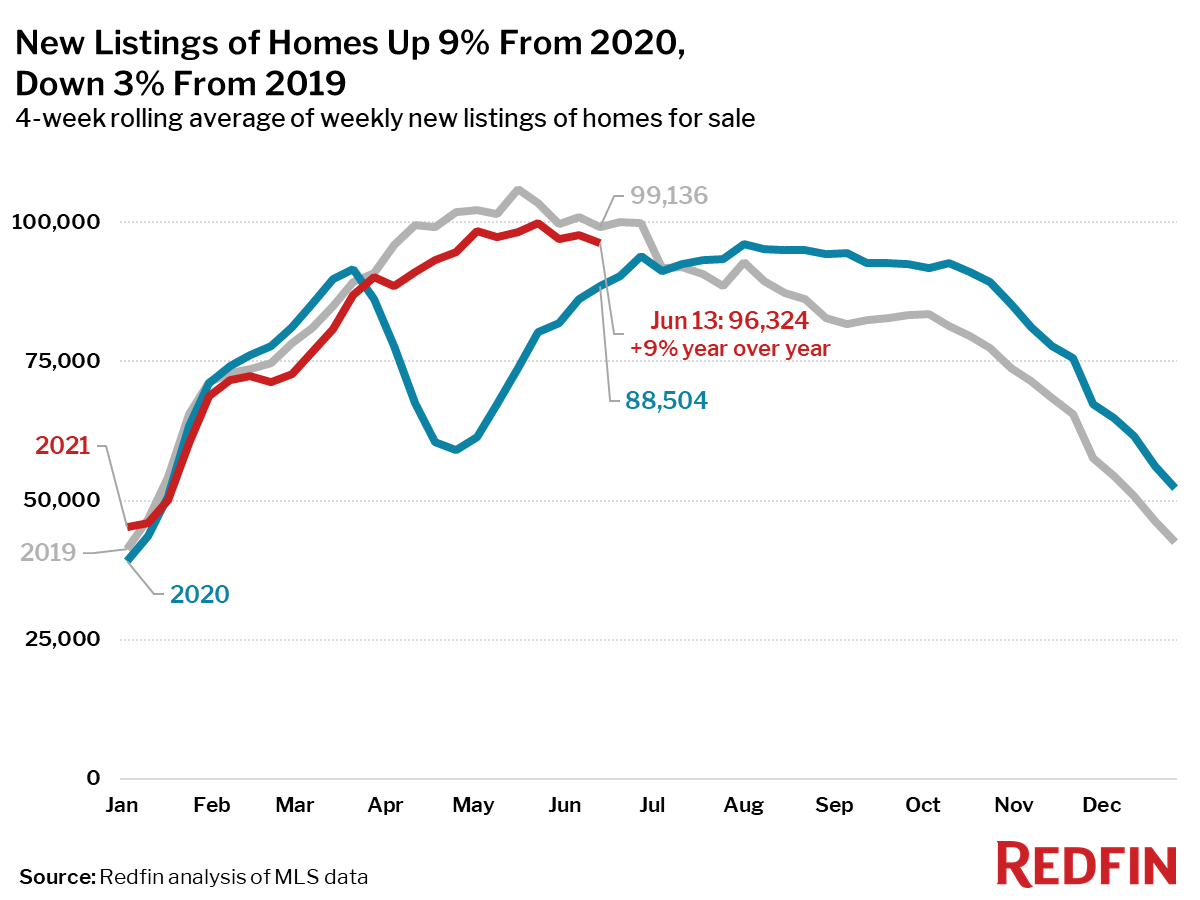 Source: Redfin 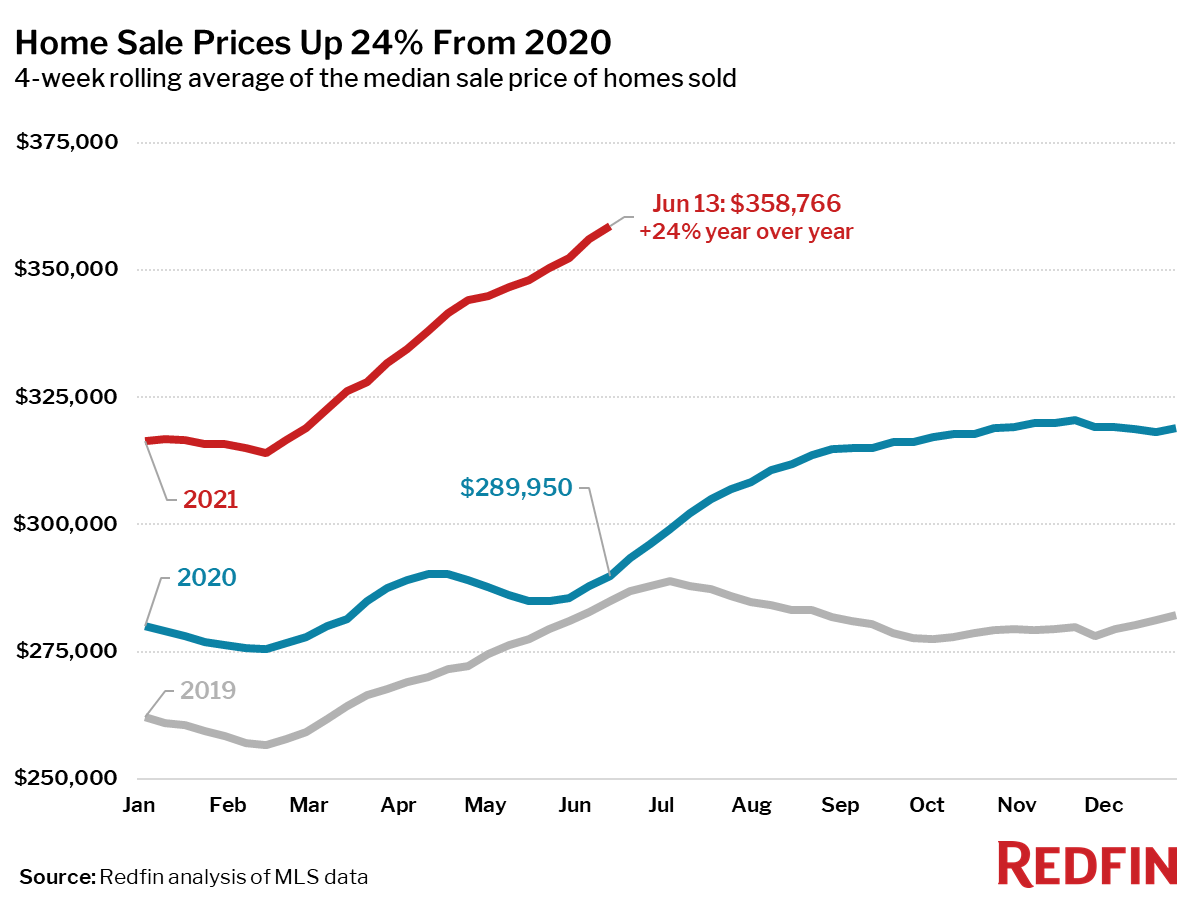 Source: Redfin Redfin Reports Homebuying Demand Lets Up a Bit as Prices Soar Redfin's Homebuyer Demand Index was down 14% from its peak 9 weeks ago, and pending sales have declined 10% from their early May peak. SEATTLE, June 18, 2021 /PRNewswire/ -- (NASDAQ: RDFN) -- Fierce competition continues to drive home prices up, but home tours, offers and pending sales have slowed, according to a new report from Redfin (redfin.com), the technology-powered real estate brokerage. New listings, a key lever for home sales growth, have held up better than pending sales and are inching up increasingly close to 2019 levels. "Offers no longer pour in the day a home hits the market," said Phoenix Redfin real estate agent John Biddle. "It has become more common for offers to come in at least a few days after a home is listed for sale. If this were three years ago, we'd marvel at how fast the market was, but it's a clear slowdown from a few weeks ago. Now that things are opening up again and the summer is almost here, people have other priorities, like going on vacation. Plus, many homebuyers are frustrated and tired of competing, so they've stepped back—for now at least." "Many measures of the housing market, such as pending home sales, mortgage applications and touring activity, showed some improvement this past week following the Memorial Day slump, but don't call it a comeback," said Redfin Lead Economist Taylor Marr. "Seasonally adjusted homebuyer demand is unlikely to rebound to the levels we saw earlier in the spring. While some buyers will find reprieve in less intense bidding wars this summer, others may be disappointed that homes remain hard to find." Key housing market takeaways for 400+ U.S. metro areas: Unless otherwise noted, this data covers the four-week period ending June 13. Redfin's housing market data goes back through 2012. Data based on homes listed and/or sold during the period: ✓ The median home-sale price increased 24% year over year to $358,766, a record high. ✓ Asking prices of newly listed homes were up 14% from the same time a year ago to a median of $363,450, down 0.2% from $364,225 during the four-week period ending June 6. ✓ Pending home sales were up 26% year over year. For the week ending June 13, pending sales were down 9.8% from the 2021 peak during the week ending May 2. ✓ New listings of homes for sale were up 9% from a year earlier, have been basically flat since early May and are now 3% below pre-pandemic 2019 levels. ✓ Active listings (the number of homes listed for sale at any point during the period) fell 35% from 2020 and have been relatively flat since late February. ✓ 56% of homes that went under contract had an accepted offer within the first two weeks on the market, well above the 43% rate during the same period a year ago, but down 0.9 percentage points from the high point of the year, set during the four-week period ending March 28. ✓ 43% of homes that went under contract had an accepted offer within one week of hitting the market, up from 31% during the same period a year earlier, but down 1.1 percentage points from the high point of the year, set during the four-week period ending March 28. ✓ Homes that sold were on the market for a median of 15 days, a new all-time low and down from 39 days a year earlier. A record 54% of homes sold above list price, up from 26% a year earlier. The average sale-to-list price ratio, which measures how close homes are selling to their asking prices, increased to 102.2%. In other words, the average home sold for 2.2% above its asking price. This measure is 3.7 percentage points higher than a year earlier and an all-time high. Other leading indicators of homebuying activity: Mortgage purchase applications increased 2% week over week (seasonally adjusted) during the week ending June 11. For the week ending June 17, 30-year mortgage rates decreased to 2.93%—the lowest level since February 25. Home tours as of June 13 were 28% above their level at the beginning of the year, compared to 50% increase at the same point last year according to home tour technology company ShowingTime. The drop in touring over Memorial Day weekend was larger this year than in 2020 or 2019, and the rebound was weaker, indicating more sensitivity to holidays as buyers travel and socialize more this year. Google Trends search interest in homes for sale has declined for three weeks in a row as of May 30. The seasonally adjusted Redfin Homebuyer Demand Index—a measure of requests for home tours and other services from Redfin agents—was down 14% from the week ending April 11, and currently just 3% above the same period last year. To view the full report, including charts and methodology, please visit: https://www.redfin.com/news/housing-market-update-homebuying-demand-slips/ About Redfin Redfin (www.redfin.com) is a technology-powered real estate broker, instant home-buyer (iBuyer), lender, title insurer, and renovations company. We sell homes for more money and charge half the fee. We also run the country's #1 real-estate brokerage site. Our home-buying customers see homes first with on-demand tours, and our lending and title services help them close quickly. Customers selling a home can take an instant cash offer from Redfin or have our renovations crew fix up their home to sell for top dollar. Since launching in 2006, we've saved customers more than $1 billion in commissions. We serve more than 95 markets across the U.S. and Canada and employ over 4,100 people. For more information or to contact a local Redfin real estate agent, visit www.redfin.com. To learn about housing market trends and download data, visit the Redfin Data Center. SOURCE Redfin via PRNewswire |
||
| Post 1 • IP flag post | ||
Pages:
1This topic is archived. Start new topic?