


RE/MAX: Homes Sell at Record Speed: April Days on Market: 32 Days Down 414894
Pages:
1
 WGAN Forum WGAN ForumFounder & WGAN-TV Podcast Host Atlanta, Georgia |
DanSmigrod private msg quote post Address this user | |
| Media Release --- RE/MAX National Housing Report for April 2021 Homes Sell at Record Speed as Median Price Reaches All-Time High DENVER, May 17, 2021 /PRNewswire/ -- On average, April home sales took just 32 days from listing to going under contract, while the Median Sales Price rose to $320,000 – both new records in the 13-year history of the report. These stats, and other key indicators, including a report record April for sales, signal a potentially torrid market going into the traditional peak sales months of May through August. April home sales in the report's 53 metro areas were up 5.3% over March, slightly topping the five-year March-to-April average gain of 5.0% from 2015-2019. In contrast, home sales in 2020 dropped 13.7% from March to April as pandemic-related stay-at-home orders were in effect in many states. Limited inventory remains a primary issue. However, with more homes coming onto the market in April, recent double-digit, month-to-month declines in active inventory dropped to just 2.4% from March to April. Still, year over year, inventory was down 42.2%. Additional context: ✓ Months Supply of Inventory reached a record low of 1.1, compared to the previous report record of 1.3 in March. ✓ Home sales were the highest for April in report history and marked the 10th highest month in the past 13 years. ✓ April's record low of 32 Days on Market trimmed four days off the previous report record of 36 days set in November 2020 – a significant change from April 2020's 46 days. ✓ The Median Sale Price jumped 5.9% over March and was the highest month-to-month increase since 6.2% from May to June 2019. "Even with rising home prices, super-quick turnarounds, and fierce competition for available listings, April 2021 saw more home sales than any April in at least 13 years. That's a clear reflection of overwhelming demand and the resilience of today's buyers," said Adam Contos, CEO of RE/MAX Holdings, Inc. "The 32 Days on Market average – a report record – is noteworthy, too. Many listings are being snapped up the day they go on sale – or within just a few days. That pace underscores the importance of an experienced professional who can guide you to smart decisions and quick action – on either side of the transaction." Although year-over-year comparisons are heavily distorted by the pandemic mitigation measures of 2020, highlights and the local markets leading various metrics for April include: Closed Transactions Of the 53 metro areas surveyed in April 2021, the overall average number of home sales was up 5.3% compared to March 2021, and up 45.2% compared to April 2020. Coastal metros led year-over-year sales percentage increases with San Francisco, CA at +121.0%, New York, NY at +112.2%, and Miami, FL +111.9%. 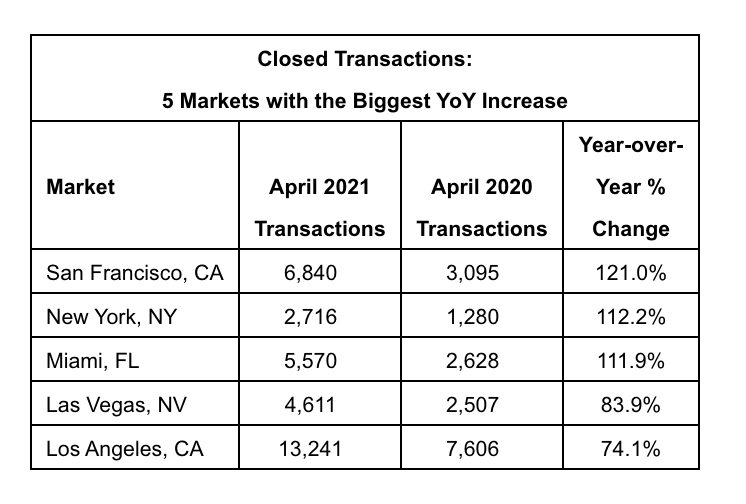 Source: RE/MAX Median Sales Price – Median of 53 metro median prices In April 2021, the median of all 53 metro Median Sales Prices was $320,000, up 5.9% from March 2021 and up 16.4% from April 2020. No metro areas saw a year-over-year decrease in Median Sales Price. Forty-two metro areas increased year-over-year by double-digit percentages, led by Boise, ID at +35.3%, Augusta, ME at +27.7%, and Los Angeles, CA at +25.2%. 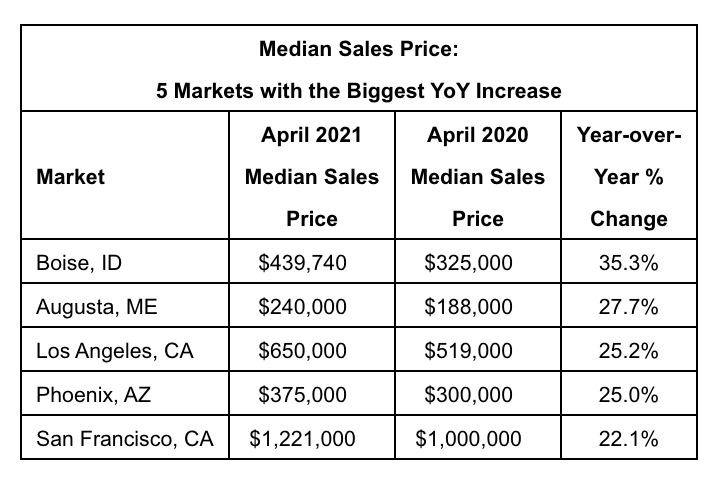 Source: RE/MAX Days on Market – Average of 53 metro areas The average Days on Market for homes sold in April 2021 was 32, down six days from the average in March 2021 and down 14 days from the average in April 2020. The metro areas with the lowest Days on Market were Wichita, KS at 12, Omaha, NE at 13, and a three-way tie between Salt Lake City, UT, Boise, ID, and Seattle, WA at 14. The highest Days on Market averages were in Des Moines, IA at 91, Miami, FL at 88, and New York, NY at 83. Days on Market is the number of days between when a home is first listed in an MLS and a sales contract is signed. 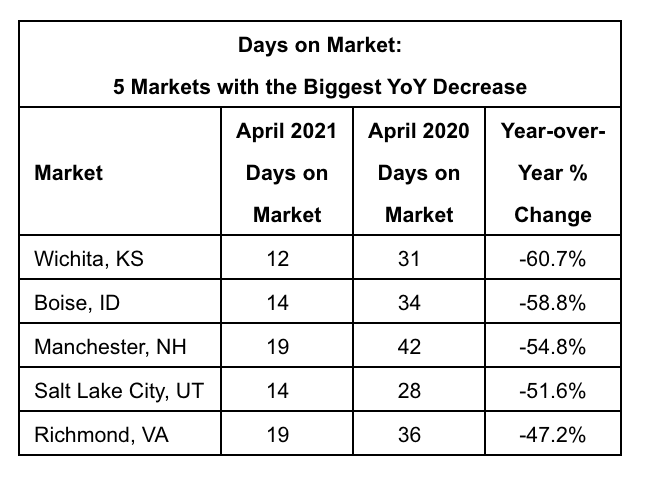 Source: RE/MAX Months Supply of Inventory – Average of 53 metro areas The number of homes for sale in April 2021 was down 1.0% from March 2021 and down 42.2% from April 2020. Based on the rate of home sales in April 2021, the Months Supply of Inventory decreased to 1.1 compared to 1.3 in March 2021, and decreased compared to 4.0 in April 2020. A six months supply indicates a market balanced equally between buyers and sellers. In April 2021, of the 53 metro areas surveyed, zero metro areas reported a months supply at or over six, which is typically considered a buyer's market. The markets with the lowest Months Supply of Inventory were Albuquerque, NM at 0.4, and a four-way tie between Raleigh-Durham, NC, Manchester, NH, Denver, CO, and Seattle, WA at 0.5. 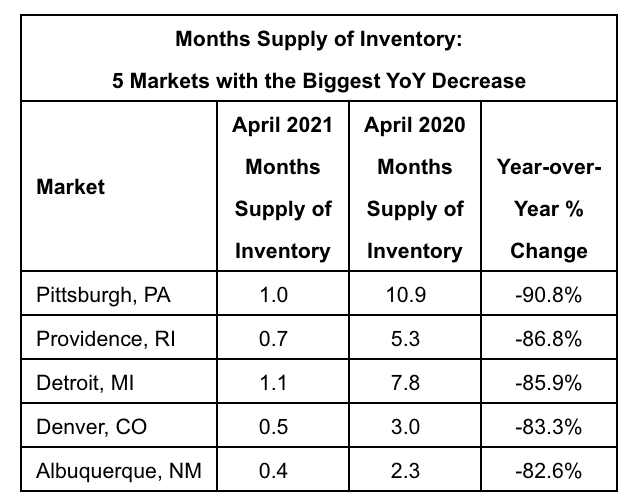 Source: RE/MAX About the RE/MAX Network As one of the leading global real estate franchisors, RE/MAX, LLC is a subsidiary of RE/MAX Holdings (NYSE: RMAX) with nearly 140,000 agents in more than 110 countries and territories. Nobody in the world sells more real estate than RE/MAX®, as measured by residential transaction sides. RE/MAX was founded in 1973 by Dave and Gail Liniger, with an innovative, entrepreneurial culture affording its agents and franchisees the flexibility to operate their businesses with great independence. RE/MAX agents have lived, worked and served in their local communities for decades, raising millions of dollars every year for Children's Miracle Network Hospitals® and other charities. To learn more about RE/MAX, to search home listings or find an agent in your community, please visit www.remax.com. For the latest news about RE/MAX, please visit news.remax.com. Description The RE/MAX National Housing Report is distributed each month on or about the 15th. The first Report was distributed in August 2008. The Report is based on MLS data in approximately 53 metropolitan areas, includes all residential property types, and is not annualized. For maximum representation, many of the largest metro areas in the country are represented, and an attempt is made to include at least one metro from each state. Metro area definitions include the specific counties established by the U.S. Government's Office of Management and Budget, with some exceptions. Definitions Transactions are the total number of closed residential transactions during the given month. Months Supply of Inventory is the total number of residential properties listed for sale at the end of the month (current inventory) divided by the number of sales contracts signed (pended) during the month. Where "pended" data is unavailable, this calculation is made using closed transactions. Days on Market is the number of days that pass from the time a property is listed until the property goes under contract for all residential properties sold during the month. Median Sales Price is the median of the median sales prices in each of the metro areas included in the survey. MLS data is provided by contracted data aggregators, RE/MAX brokerages and regional offices. While MLS data is believed to be accurate, it cannot be guaranteed. MLS data is constantly being updated, making any analysis a snapshot at a particular time. Every month the RE/MAX National Housing Report re-calculates the previous period's data to ensure accuracy over time. All raw data remains the intellectual property of each local MLS organization. SOURCE: RE/MAX, LLC via PRNewswire |
||
| Post 1 • IP flag post | ||
Pages:
1This topic is archived. Start new topic?